
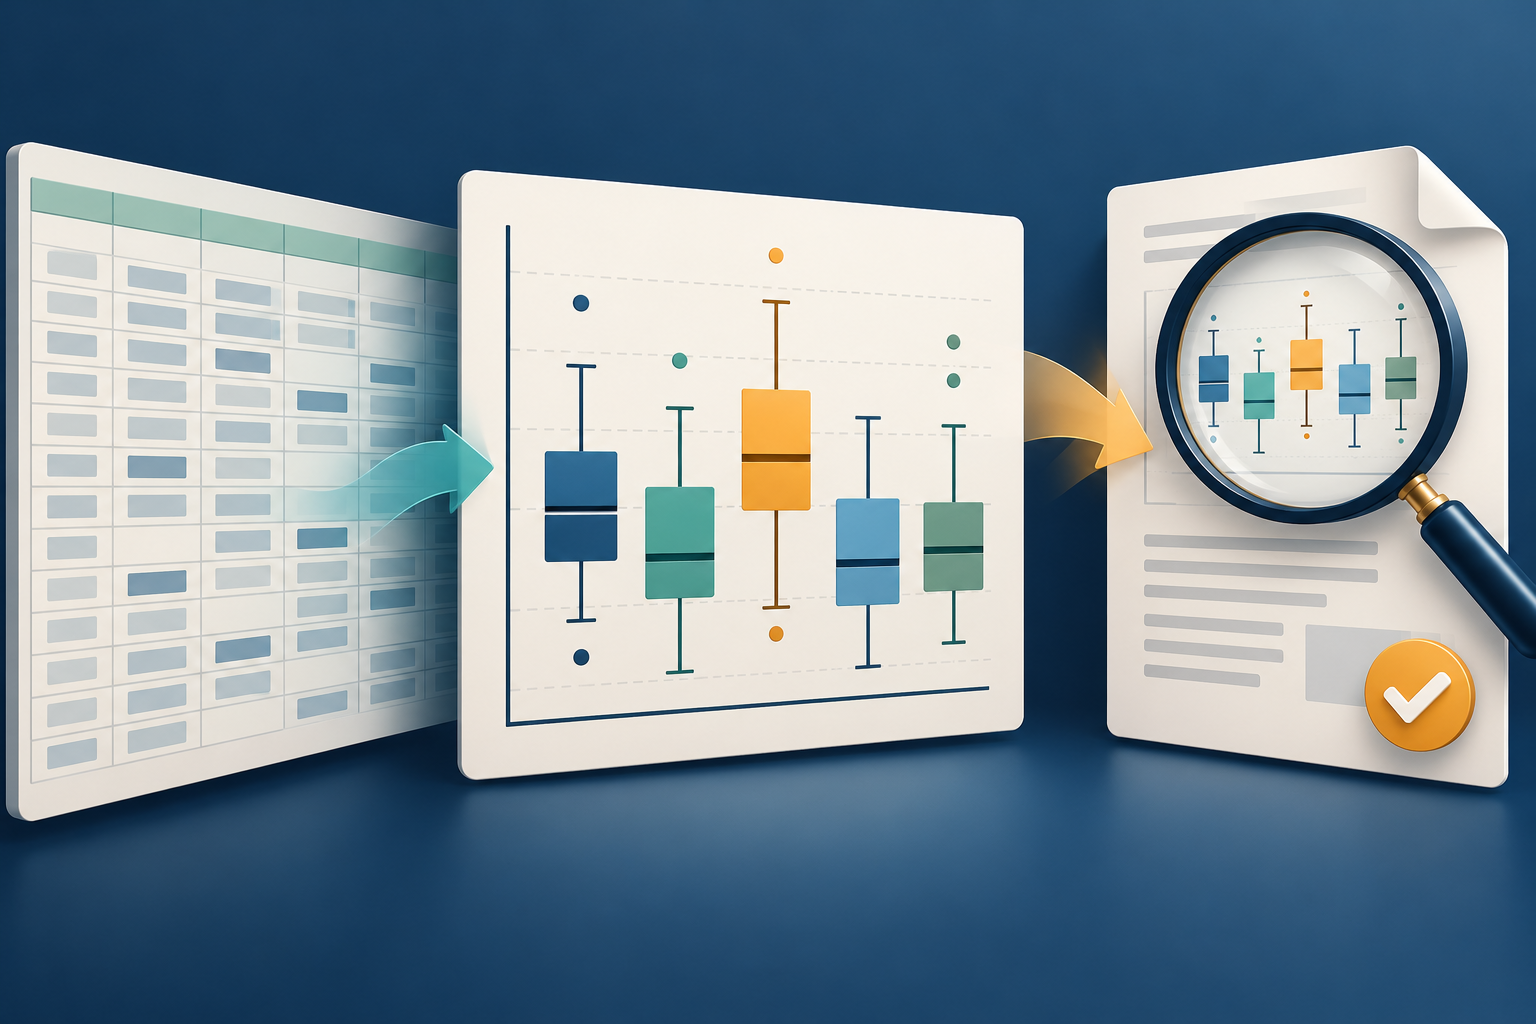
A box-and-whisker chart can condense hundreds of values into a compact view of spread, centre and possible outliers. That efficiency also makes it easy to overlook a wrong range, an unexplained quartile setting or a label that becomes unreadable in a PDF. Google Sheets now builds these charts natively, so a careful review belongs in the workflow from the first selected cell to the final shared page.
What Google released
On 22 October 2026, Google announced native box-and-whisker charts in Sheets. From a selected range of raw numbers, Sheets can calculate the minimum, first quartile, median, third quartile, maximum, mean and outliers without helper formulas. Users can choose inclusive or exclusive quartile calculation and show or hide inner points, outliers, mean markers and mean lines.
Google also says Excel compatibility has improved. An imported Excel box plot is now preserved with its data references, calculations and formatting, while a chart created in Sheets can be exported to Excel as an editable box plot. That is useful for mixed-tool teams, but preservation is not validation: an editable chart can still point at incomplete data or express an undocumented statistical choice.
Rollout is gradual. Rapid Release domains began receiving the feature on 22 October, with up to 15 days for visibility; Scheduled Release domains start on 6 November. Google lists all Workspace customers and personal Google accounts as eligible.
Review the chart before it becomes a report
1. Verify the source range. Open the chart setup and compare the selected cells with the intended dataset. Check headings, units, blank cells, filtered rows and whether categories cover the same reporting period. Google's chart help page describes the data range as the cells included in the chart; a polished shape does not prove that the right cells were selected.
2. Record the quartile method. Inclusive and exclusive quartile calculations can produce different values, especially in small datasets. Choose the method required by the course, organisation or analysis plan and name it in the report. If no method was specified, document the choice instead of presenting it as universal.
3. Interpret outliers carefully. A plotted outlier is a flag for investigation, not automatic evidence of an error. Check the original record, units and collection method. Do not silently remove an inconvenient point; explain any authorised exclusion and retain the source.
4. Add the missing context. Give the chart a descriptive title, axis labels, units, period and a short written finding. State the sample size where it matters. A box plot shows distribution, not the reason a pattern occurred, and it may hide clusters or other details in the underlying data.
5. Test the actual handoff. If colleagues use Excel, open a copy of the exported workbook and compare ranges, quartiles, labels and visible points. Google's compatibility claim does not guarantee that every workbook, font, extension or downstream system will render identically. Keep the checked source separately.
6. Inspect the PDF, not just the sheet. Export the intended report and check page size, clipping, colour contrast, label size and whether the legend is understandable without interaction. Include a brief text explanation and, where required, an accessible data table. A clear-looking PDF is not automatically accessible, and a screenshot of a chart does not expose its source values.
Where FileStation fits
After an authorised report has been exported, FileStation's PDF Reader can help with a page-by-page visual check. The CLEAR document check offers a simple final-review routine before release. FileStation does not calculate quartiles, verify the dataset or certify accessibility.
The valuable upgrade is not merely a new chart button. It is a shorter route to a useful statistical view—paired with an explicit check of the data, method, interpretation and static document the recipient will actually receive.